Azuro UI Builders Hackathon
This page contains helpful materials to succeed in the tasks. For all information about the hackathon, go to the hack’s website .
Materials
Tutorials
The most helpful entities for this hack’s tasks are Game, Condition, Sport, League, and Country.
- The
Gameentity provides details about game status, participants, and the associated betting conditions. It’s useful for organizing games into categories like live, upcoming, or resolved, and showing detailed game-level data (e.g., participants, turnover). Conditionentity is helful for building markets around individual game conditions and fetching the latest odds. You can use this entity to show bettors the markets available within a game.Country, League, Sportentities help in organizing betting markets and displaying relevant statistics by region, league, or sport. Great for creating custom market views, where users can explore betting opportunities by region or sport. You can also organize games by league or tournament.
Workshop recording: https://www.youtube.com/watch?v=FHuZlybJAw0&ab_channel=AzuroChannel
How to group and sort outcomes & markets
Templates
Main Azuro template (follow this template’s project structure and tech stack even if you take the orderbook template as a basis for your design)
Task clarifications
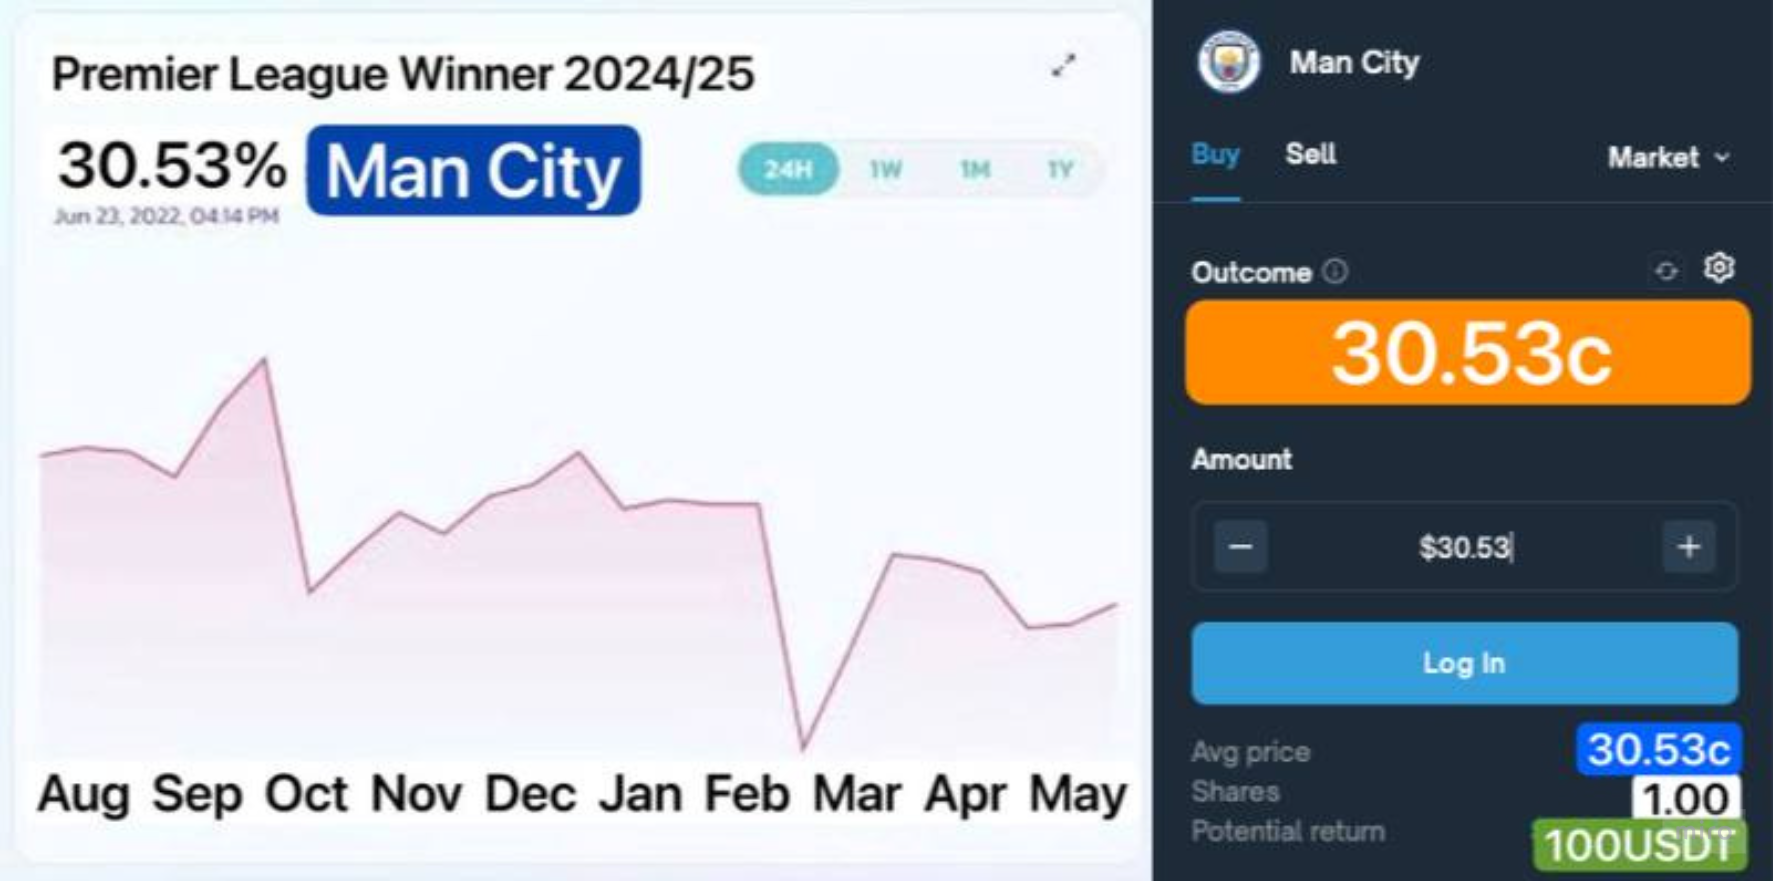
Bonus feature: Historical price chart that reflects market dynamics
Fetch historical odds / prices for each pre-match event and display their dynamic change over time in the form of an interactive diagram.
- Transform Azuro’s AMM data into a historical line chart format
- The chart’s x-axis to denote the time period, while the y-axis denotes odds (in form of percentages). Users should be able to select shorter/longer time periods — the chart will zoom in/out (i.e., zooming in to view daily odds and zooming out to view monthly odds).
- Chart should display the exact percentage odds and timestamp when hovering on a specific point
Example:
Step-by-step instructions
Step 1: Project setup
Download the template, this will be the base of your project: https://github.com/Azuro-protocol/example-app
Understand the structure: Look into the src/components and src/pages folders. These contain various small interface elements (e.g., headers, buttons, betting markets), while src/compositions combines them into bigger UI elements that follow the business logic of the template app (e.g., betslip, games & odds, top events)
Step 2: Design your UI
Design with a user persona / use case in mind
- Identify your user persona or use case: think about the type of users your app is targeting.
For example:
- Casual crypto degen: wants simplicity and quick access to best odds and key information.
- Advanced sports bettor: prefers detailed markets, sports organized by leagues and tournaments.
- Wireframing and design: Draw a basic wireframe (you can use tools like Figma) that outlines where your UI elements will go. Create a design for these elements that you can then transfer into your frontend. For example:
- If your target is casual users, design simple and clear UIs. Use groupings of data into such categories as best events by turnover, most popular events, or championship brackets.
- For advanced users, display complex information, such as historical odds charts, suggestions on winning parlay combinations, or for example, search bar to look for their favourite events.
Step 3: Fetching and displaying data in your UI elements
- Fetch data using React hooks from AzuroSDK and helpers from Azuro Toolkit. They organize GraphQL queries in Typescript utilities that are very helpful to import and reuse.
- Descriptions of Azuro custom GraphQL queries: https://gem.azuro.org/subgraph/queries/sports/sporthub
- SDK guides and knowledge base: https://gem.azuro.org/hub/apps/sdk
- Tooklit knowledge base: https://gem.azuro.org/hub/apps/toolkit
- Display fetched data in your components. Remember to keep smaller reusable UI elements in
src/componentssection, and bigger, unique components insrc/compositions.
Step 4: Prepare to submit the project
- Submit the GitHub repository link of your project and a link to the video demo of your result.
- In your Readme file, mention the design choices you made and highlight any unique features you implemented.
- Submit it via the form: https://azuro.typeform.com/to/PasYOoNb
Motivating your design choices
Design choices in your project shouldn’t be merely cosmetic; they should be driven by a clear idea. Therefore, we suggest creating a new UI tailored to a specific end-user persona or use case. Who is your potential user? Is he/she a degen who’s unfamiliar with prediction markets and wants to earn fast by betting on the best odds? Then organize the data to display the top events with best odds on your home screen. Is your user a sports betting pro? Then organize the data to display events as a series of championship brackets for separate sports events, etc. Feel free to add new elements, such as a placeholder for promotional banners - you can get inspiration in apps built on Azuro.
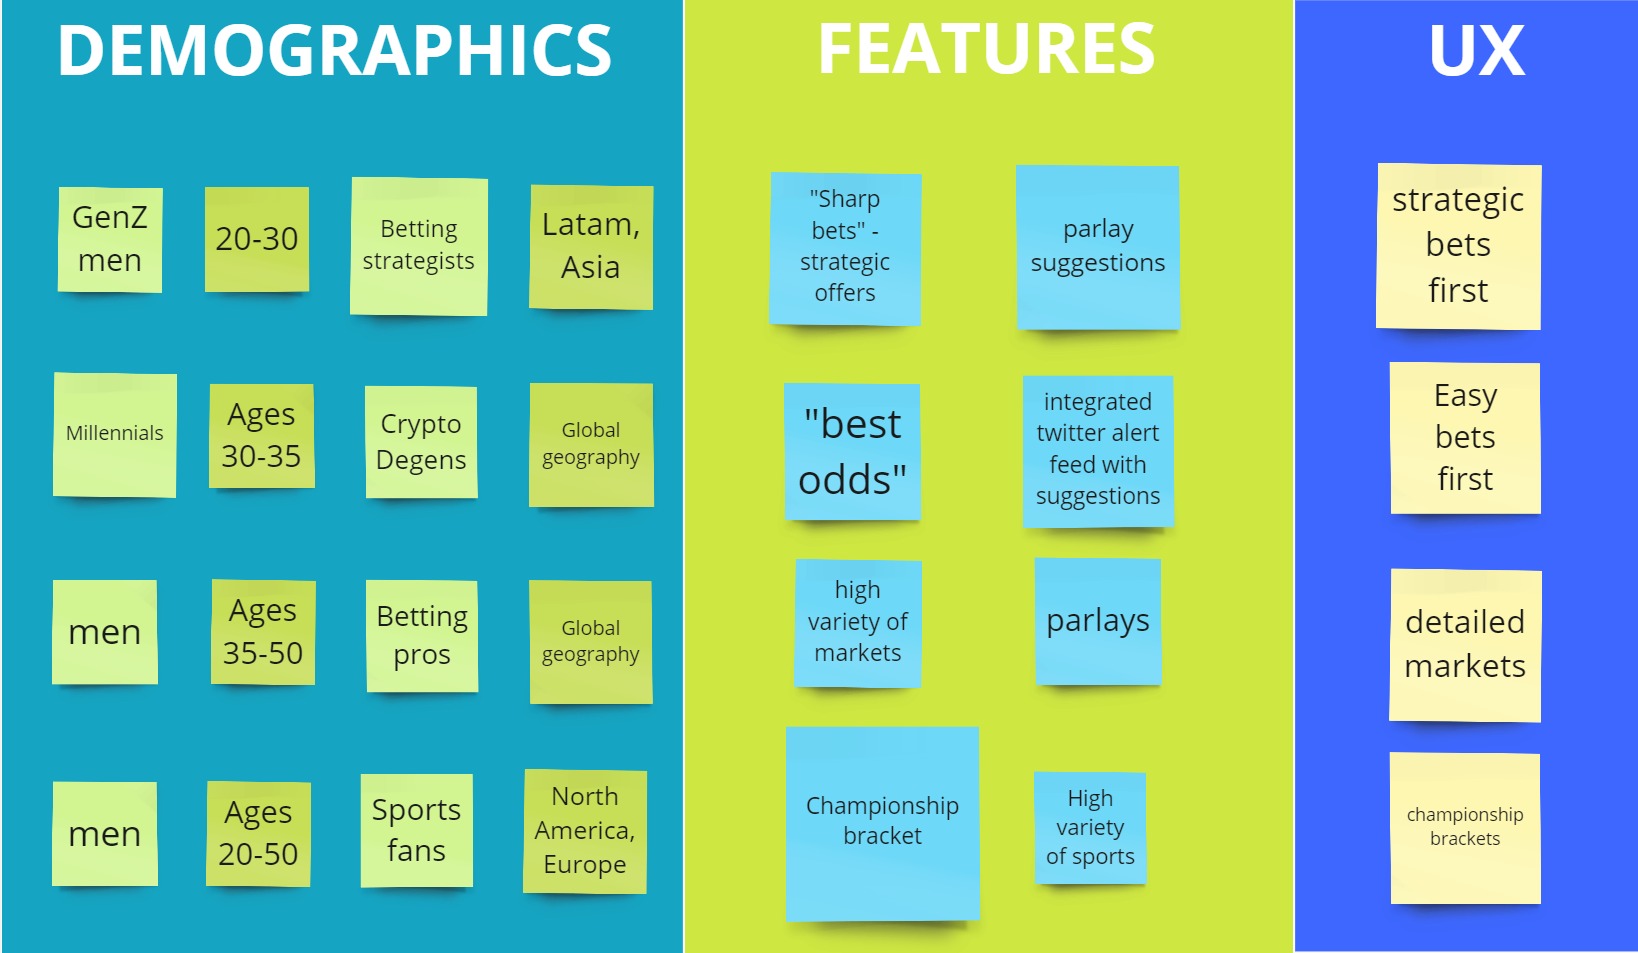
Here’s how you might approach motivating your design choices by a user persona. For example, you might delineate different demographics based on their age, level of betting expertise, crypto use behavior, location, etc.
User persona map example
Support
https://discord.com/channels/880927413742219374/1280121816987467880